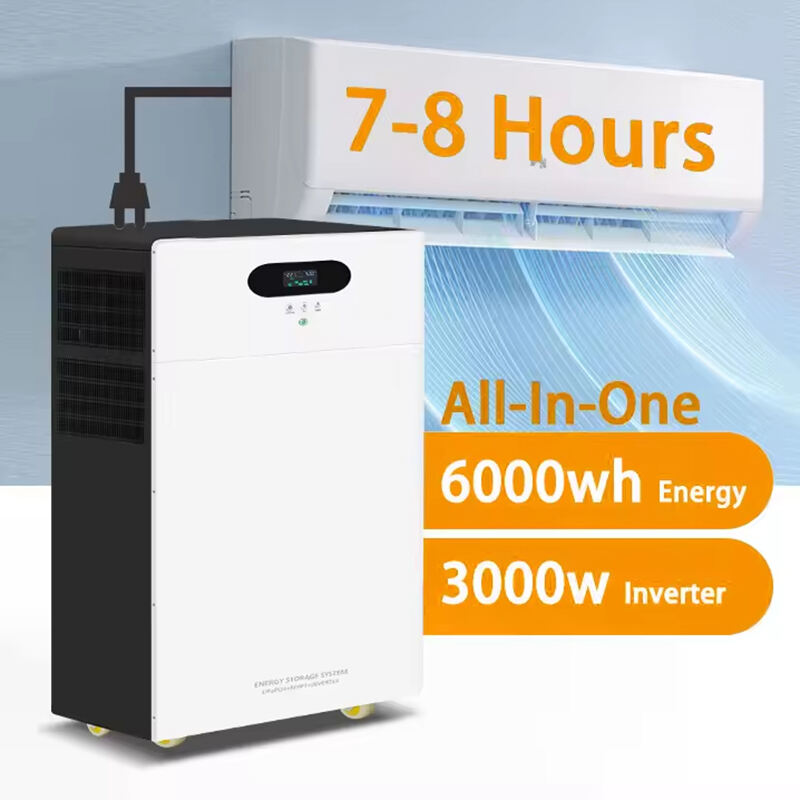
Assess Your Daily Energy Consumption for Accurate Home Energy Storage Sizing
Tracking kWh Usage via Utility Bills and Smart Meters
Looking at 12 months worth of utility bills gives a good starting point for understanding energy habits. The average home in the UK uses somewhere between 10 and 30 kWh each day according to recent figures. Smart meters really help put things into perspective though. They show exactly when electricity is being used throughout the day, often revealing those late afternoon spikes when people come home from work just as solar power production drops off. These devices also spot hidden drains on the system that slowly eat away at the bottom line, sometimes adding 5 to 10 percent extra costs without anyone noticing. When comparing monthly statements against what the smart meter records, it becomes clear how much seasonal changes affect consumption patterns. Heating during winter months versus air conditioning needs in summer can create differences of nearly 40 percent from one month to the next.
Essential Appliance Load Analysis with Real-World Wattage Estimation
Build an appliance inventory using manufacturer labels or plug-in energy monitors. Focus on essential loads—those needed during outages—and use realistic runtime estimates, not just nameplate wattage. Key examples include:
- Refrigeration (150–400W running, typically ~8–12 hours/day)
- LED lighting (5–15W per bulb, average 3–5 hours/day per fixture)
- Communication devices (20–100W, often operating continuously)
Calculate daily kWh with: (Wattage × Hours Used) ÷ 1000. For instance, a 300W refrigerator running 10 hours consumes 3 kWh—not 7.2 kWh—reflecting actual cycling behaviour. Sum these values to determine your essential load; most homes require 5–15 kWh/day to maintain core functionality during grid outages.
Accounting for Seasonal Variability and Peak Demand Patterns
Energy demand definitely moves around quite a bit throughout the year. During hot summers, air conditioners alone can push electricity use three times higher than normal. Winter brings different challenges too, with electric heating causing those big spikes first thing in the morning and again when people get home from work. Looking at smart meter readings helps spot these peak times usually between 6 and 9 AM, then again from 4 PM until dinner time when all sorts of appliances kick in at once. Some studies out of the UK suggest that really bad weather days tend to bump up what households consume by anywhere between a quarter to half more than usual. When planning storage solutions, it's wise to think about those worst case scenarios during each season rather than just going by average figures. Adding somewhere between 20% to 30% extra capacity makes sense too since nobody wants to be caught short if something unexpected happens or when new electric gadgets like cars or heat pumps get added to the mix down the road.
Frequently Asked Questions (FAQ)
Q1: How do smart meters help in monitoring energy usage?
A1: Smart meters provide real-time data on electricity usage, revealing patterns such as peak usage times and identifying hidden energy drains, helping to better understand and manage energy consumption.
Q2: Why is it important to account for seasonal variability when sizing home energy storage?
A2: Seasonal variability significantly impacts energy demand, with higher consumption in extreme weather conditions. Including this variability in storage sizing ensures adequate capacity during peak demand times throughout the year.
Q3: How can I calculate the daily energy consumption of my essential appliances?
A3: Calculate the daily kWh by multiplying the appliance’s wattage by the hours it’s used daily, then dividing by 1000. Summing up these values for all essential appliances gives you the total daily consumption.